Earthquakes around the world

An 8.2 M quake that nobody noticed???


'Invisible' earthquake caused mysterious 2021 tsunami, scientists find​


By Ben Turner published 3 days ago
Some tsunami-generating earthquakes are invisible to our monitoring systems.

From its origin point in the South Atlantic, the 2021 tsunami sent ripples all over the world.

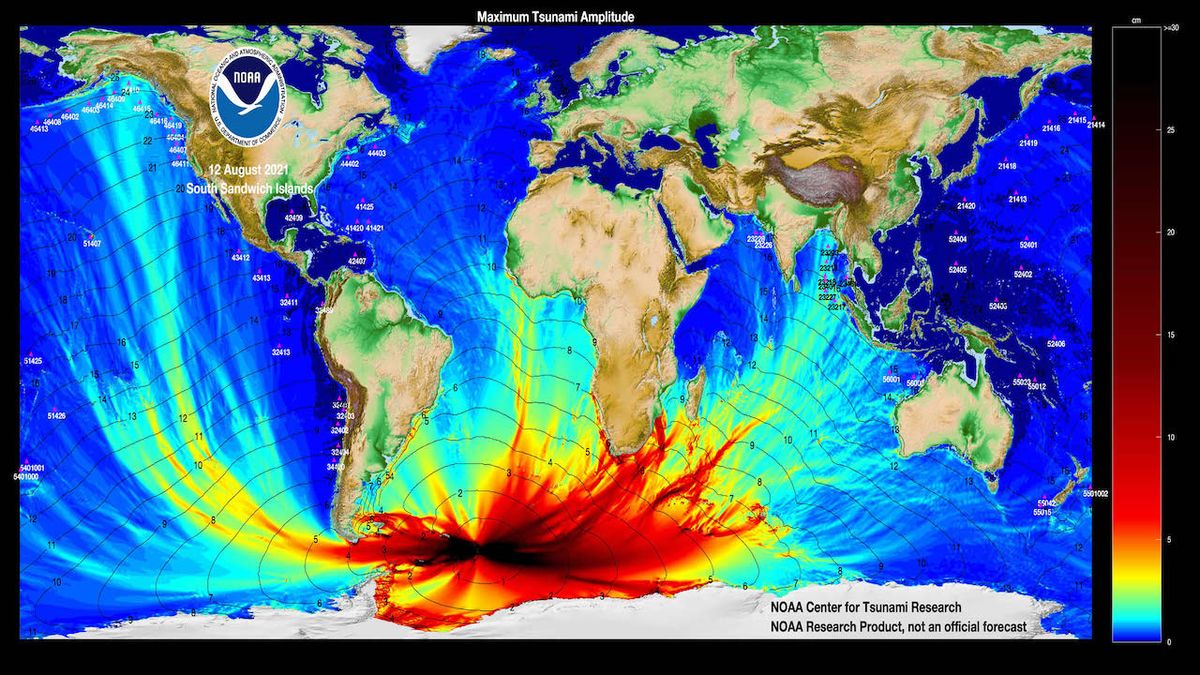
From its origin point in the South Atlantic, the 2021 tsunami sent ripples all over the world. (Image credit: NOAA Center for Tsunami Research)


The mysterious source of a globe-spanning tsunami that spread as far as 6,000 miles (10,000 kilometers) from its epicenter was an "invisible" earthquake, a new study has found.

In August 2021, an enormous tsunami rippled out into the North Atlantic, Pacific and Indian oceans. It was the first time a tsunami had been recorded in three different oceans since the catastrophic 2004 Indian Ocean earthquake; at the time, scientists thought it was caused by a 7.5-magnitude earthquake detected near the South Sandwich Islands (a British Overseas Territory in the southern Atlantic Ocean).
But not everything was as it seemed. Scientists were baffled to find that the supposed epicenter of the earthquake was 30 miles (47 km) below the ocean floor, which is far too deep to cause a tsunami, and that the tectonic plate rupture that spawned it was nearly 250 miles (400 km) long — that kind of rupture should have caused a much larger earthquake.

Now, a new study published Feb. 8 in the journal Geophysical Research Letters, has revealed that the earthquake was actually a sequence of five sub-quakes, separated in time by mere minutes. And the third of these mini-quakes — a shallower, "invisible" earthquake hidden in the data and missed by monitoring systems at the time — was an 8.2-magnitude quake responsible for the tsunami.

"The third event is special because it was huge, and it was silent," Zhe Jia, a seismologist at the California Institute of Technology, said in a statement. "In the data we normally look at [for earthquake monitoring], it was almost invisible."

The researchers were able to retrieve the third quake's signal from the tangle of seismic waves by chopping up the data into longer, 500-second chunks and using an algorithm to tease out its constituent parts. Only then did the 200-second quake, which Jia said made up 70% of the energy released during the entire event, appear. The hidden quake, which ruptured a 125-mile-long (200 km) interface between two plates, took place just 9.3 miles (15 km) beneath Earth's surface — an ideal depth to spawn a tsunami.

The researchers say that the earthquake stayed hidden because it was a hybrid between two types of ocean earthquakes, the "deep rupture" type that results from a sudden slipping of plates, and a "slow tsunamigenic slip" created by a much slower, sometimes weeks-long grinding of one plate against another. Slow slip earthquakes can release just as much tectonic energy as a high-magnitude earthquake, but their slow pace, alongside the fact that they don't cause any pronounced seismic shaking, can often make them hard to detect.

In fact, most earthquake and tsunami warning systems tend to focus on tracking the short to medium periods of seismological waves, leaving waves with longer periods, which are still capable of generating life-threatening tsunamis, buried inside the data, Jia said. The researchers want to change this, and have set out a long-term goal to design a system that can automatically detect and warn coastal regions about more complex tsunami-causing quakes in much the same way that current systems do for simpler ones.

"With these complex earthquakes, the earthquake happens and we think, 'Oh, that wasn't so big, we don't have to worry.' And then the tsunami hits and causes a lot of damage," Judith Hubbard, a geologist at the Earth Observatory of Singapore who was not involved in the study, said in the statement. "This study is a great example of how we can understand how these events work, and how we can detect them faster so we can have more warning in the future."

Originally published on Live Science.
 
An 8.2 M quake that nobody noticed???


At that time it was only recorded as a single earthquake on August 12, later USGS updated the data

USGS just updated their report to say that the main quake was actually an M8.1, the M7.5 was a foreshock that occurred 170 seconds earlier.

According to Volcanodiscovery the first M7.5 event took place at 18:32 GMT followed by the M8.1 event three minutes later. Fourteen minutes later an M6.0 aftershock happened and in fact there were several aftershocks that day

chrome_screenshot_1644833695617.png

Earthquake Archive: Past Quakes worldwide during August 2021
 
EARTHQUAKE REPORT PAST 24HRS

▪︎5 quakes above magnitude 5
▪︎39 quakes between magnitude 4 and 5
▪︎133 quakes between magnitude 3 and 4
▪︎208 quakes between magnitude 2 and 3
▪︎480 quakes below magnitude 2 that people normally don't feel.

A strong magnitude 5.7 earthquake occurred in North Pacific Ocean, Guam, 18 hours ago.

Strongest quake today: 5.7 quake North Pacific Ocean, 197 km south of Tamuning-Tumon-Harmon Village, Guam, Feb 14, 2022 6:49 am (GMT +10) - 18 hours ago

Latest quake: 3.2 quake 36 km north of Gyumri, Shirak, Armenia, Feb 14, 2022 6:13 pm (GMT +4) - 28 minutes ago

Earthquakes Today: Latest Quakes worldwide past 24 hours
 
EARTHQUAKE REPORT PAST 24HRS

▪︎2 quakes above magnitude 5
▪︎37 quakes between magnitude 4 and 5
▪︎123 quakes between magnitude 3 and 4
▪︎237 quakes between magnitude 2 and 3
▪︎523 quakes below magnitude 2 that people normally don't feel.

A strong magnitude 5.7 earthquake occurred in 207 km W of Olonkinbyen, Jan Mayen, 19 hours ago.

Strongest quake today: 5.7 quake 207 km west of Olonkinbyen, Jan Mayen, Feb 14, 2022 7:28 pm (GMT -1) - 19 hours ago

Latest quake: 2.6 quake Tasman Sea, 22 km northwest of Nelson, New Zealand, Feb 16, 2022 4:04 am (GMT +13) - 20 minutes ago

Earthquakes Today: Latest Quakes worldwide past 24 hours
 

Strong mag. 6.2 earthquake - 33 km southwest of Santa Lucia Cotzumalguapa, Guatemala

Date & time: Feb 16, 2022 07:12:25 UTC - 39 minutes ago
Local time at epicenter: Wednesday, Feb 16, 2022 at 1:12 am (GMT -6)
Magnitude: 6.2
Depth: 83.6 km

Epicenter latitude / longitude: 14.1934°N / 91.2969°W
GT.png
(Municipio de Nueva Concepcion, Departamento de Escuintla, Guatemala)
Antipode: 14.193°S / 88.703°E
Nearest volcano: Atitlán (45 km / 28 mi)
According to official data published by the National Institute of Seismology, Volcanology, Meteorology and Hydrology of Guatemala, the M6.8 earthquake (M6.2 USGS) was located 54 km from Mazatenango and 84 km from Escuintla and was felt in El Salvador and southeastern Mexico.


In some areas near the Guatemalan coast, losses of electrical service were reported; In addition, the tremor caused some damage to homes, according to the preliminary report.


Volunteer firefighters report damage and landslides on the highway that leads from Antigua Guatemala to the capital city

 
The below article suggest that the is a 70-80% probability in the next 30 year of a Nankai Trough megathrust earthquake. The researchers analysed Long-term slow slip event (L-SSE) using longitudinal GNSS data provided by the Geospatial Information Authority of Japan and found that the the L-SSE event of of 2018 - 2019 while shorter in terms of duration was bigger than in terms of Slippage amount, slip velocity and seismic movement


Better prediction of megathrust earthquakes: Illuminating slow slip plate tectonics in south-western Japan​

  • February 14, 2022
  • Research Center for Urban Safety and Security, Graduate School of Science
  • News
Within the next 30 years, a highly destructive Nankai Trough megathrust earthquake is predicted to hit southwest Japan. Understanding long-term slow slip events (L-SSE*1) that occur along the plate interface between the subducting Philippine Sea plate and overriding Amurian plate under the Bungo Channel is essential for pinpointing when such an earthquake will happen. To this end, Kobe University’s Professor YOSHIOKA Shoichi (Research Center for Urban Safety and Security) and SESHIMO Yukinari (1st year Masters student, Department of Planetology, Graduate School of Science) analysed the 2018-2019 Bungo Channel L-SSE using longitudinal GNSS data*2 provided by the Geospatial Information Authority of Japan.
They revealed that even though the 2018-2019 event was shorter than past L-SSEs in this region, it was also bigger in terms of slippage amount and slip velocity, as well as seismic moment and moment magnitude. This and their other findings provide further insight into the behaviour of L-SSEs in the Bungo Channel.
These results were publicized in the online journal ‘Scientific Reports’ on January 10, 2022 at 10 am GMT. This journal is published by the Nature Publishing Group (UK).

Main points​

  • Illuminating slow slip distribution in the Bungo Channel is important for understanding the causal mechanism behind a Nankai Trough megathrust earthquake, which has been predicted to occur in the near future.
  • This research group illuminated the spatiotemporal distribution of the slow slip event that occurred in 2018-2019
  • Despite taking place over the shortest time period, the 2018-2019 event was the highest recorded so far in terms of slippage amount and slip velocity, as well as seismic moment*3 and moment magnitude*4 compared to past slow slip events in the Bungo Channel.
  • The 2018-2019 event resembled the 2002-2004 slow slip in terms of starting location, slip distribution and the order in which sub-events occurred.

Research Background​

2022_02_14_01-01.png

Figure 1: Tectonic map of the area around the Bungo Channel
The Philippine Sea plate is subducting in a north-westerly direction beneath the Amurian plate. Red dots represent the GNSS stations used in the analysis. The red line is a horizontal projection of the analyzed area. The large blue circle indicates the general location where Bungo Channel L-SSE occurred.
In the Bungo Channel, which is located between Shikoku and Kyushu in southwest Japan, the Philippine Sea plate is subducting in a north-westerly direction beneath the Amurian plate. Every 6 or so years, long-term slow slip events (L-SSE) repeatedly occur along the plate interface beneath this region. Each of these L-SSEs last between several months to a couple of years.
Studies conducted up until now have analyzed the slip distributions of L-SSEs that occurred in the following periods: 1996-1998, 2002-2004, and 2009-2011. It has been indicated that there is a possible relationship between these events and the occurrence of a Nankai Trough megathrust earthquake.
Illuminating the slip distributions of L-SSE in the Bungo Channel is considered vital for understanding how such a megathrust earthquake occurs. Therefore, Kobe University researchers decided to conduct a new analysis of the L-SSE that happened during the 2018-2019 period.

Research Methodology and Findings​

Using longitudinal GNSS data, the researchers calculated the spatiotemporal distribution of the Bungo Channel L-SSE that occurred in 2018-2019. From the results, they understood that this event could be divided into 2 sub-events; the 1st sub-event spanning March to July 2018 (0.1 of a year = 36.5 days) and occurring under the southwest side of the Bungo Channel, and the 2nd sub-event that occurred from August 2018 to April 2019 directly beneath the central part of the Channel.
The 2018-2019 L-SSE, at one year in duration, lasted for the shortest length of time compared to past Bungo Channel L-SSEs that have been analyzed. Despite this, the 2018-2019 L-SSE was the biggest event in terms of slippage amount and slip velocity, as well as seismic moment and moment magnitude. Furthermore, the researchers also discovered that the 2018-2019 L-SSE was similar to the 2002-2004 L-SSE in terms of starting location, slip distribution and the order in which sub-events occurred. In the past, there have been intervals of approx. 6 years between the occurrence of each L-SSE, however the 2018-2019 L-SSE took place around 8 years after the previous event, which was in 2009-2011.
2022_01_13_01-02.png

Figure 2: Slip distribution of the 2018-2019 Bungo Channel L-SSE
Shows the continuous analysis results for every 0.1 year= 36.5 day period. The arrows denote the direction and amount of slippage for the overriding plate against the subducting plate at the plate interface. The color contours indicate the amount of slippage with intervals of 1cm. Grey indicates the areas for which the dependability of the analysis results is low.
2022_01_13_01-03.png

Figure 3: Dual axis chart to show the temporal development of 4 Bungo Channel L-SSEs in terms of seismic moment (left y-axis) and moment magnitude (right y-axis).
Yellow: 1996-1998 L-SSE, Blue: 2002-2004 L-SSE, Green: 2009-2011 L-SSE, Red: The 2018-2019 L-SSE uncovered by this study. The graph shows the temporal development of each L-SSE’s seismic moments and moment magnitude. The pink dotted lines indicate the periods during which the 2018-2019 L-SSE’s two sub-events occurred.
2022_01_13_01-04.png

Figure 4: Spatial distribution of the amount of slippage during the 2002-2004 Bungo Channel L-SSE and the 2018-2019 Bungo Channel L-SSE.
Blue (2002-2004) and red lines (2018-2019) show the 5cm contour intervals between the two L-SSEs. (a) is the spatial distribution of the slippage amount for the 1st sub-event, (b) is the 2nd sub-event. (c) shows the overall spatial distribution of slippage for both L-SSEs.

Further Research​

The Bungo Channel L-SSEs have taken place at the downdip of the plate interface adjacent to the hypocenter of the Nankai Trough megathrust earthquake, which is estimated to occur with a 70~80% probability in the next 30 years. Monitoring the spatiotemporal changes in the behaviour of these kinds of slow earthquake*5 is vital for enabling seismologists to detect the early signs of a megathrust earthquake. These observations have revealed spatiotemporal changes in the slip distribution of the 2018-2019 Bungo Channel L-SSE, highlighting the great importance of comparing recent L-SSE with past events. Next, the researchers will monitor the slippage and adhesion where the plates intersect beneath the Bungo Channel. By furthering their analysis, they hope to illuminate the mechanisms by which earthquakes occur and to enable the early detection of the coming Nankai Trough megathrust earthquake.

Glossary​

*1 Long-term slow slip event (L-SSE)This phenomenon occurs at a subduction interface (where one plate is thrust beneath another). Over a period ranging from a few months to a few years, part of the plate interface slowly slips- this is an L-SSE.*2 Longitudinal GNSS dataThe Geospatial Information Authority of Japan has around 1300 GNSS (Global Navigation Satellite System) stations located throughout Japan that collect temporal data on seismic shifts.*3 Seismic momentThis is a measure of an earthquake’s size based on the area of fault rupture, the average amount of slip, and the force that was required to overcome the friction sticking the rocks together*4 Moment magnitudeMagnitude that is calculated based on long seismic waves (that have a duration of over 10 seconds) and the shape of these waves. It can also be determined from seismic moments*5 Slow earthquakeAn earthquake phenomenon in which a fault rupture gradually occurs. Slow earthquake is a general term for a variety of time constant phenomena where a fault slips; including low frequency earthquakes, ultra-low frequency tremors and earthquakes, and short-term and long-term slow slip events.
 
Earthquake outside the Ring of Fire.


According to Professor Andrzej Kijko from the University of Pretoria's Natural Hazard Centre, mining can activate natural faults. He believes that 95% of South Africa's earthquakes are caused by mining, especially around the areas of Klerksdorp, Welkom and Carletonville. According to earth science consultant Dr Chris Hartnady, "This part of Africa is in the vicinity of the African Rift system, which is being pulled apart by a few millimetres annually." He says "earthquakes are caused by a slip on a fault line and the release of stored elastic energy" and mining activity can trigger earthquakes

 
EARTHQUAKE REPORT PAST 24HRS

▪︎1 quake above magnitude 6
▪︎3 quakes between magnitude 5 and 6
▪︎41 quakes between magnitude 4 and 5
▪︎110 quakes between magnitude 3 and 4
▪︎190 quakes between magnitude 2 and 3
▪︎452 quakes below magnitude 2 that people normally don't feel.

A strong magnitude 6.2 earthquake hit Departamento de Escuintla, Guatemala, 9 hours ago.

Strongest quake today: Magnitude 6.2 33 km SW of Santa Lucia Cotzumalguapa, Guatemala - 9 hours ago

Latest earthquake: 2.6 quake Greece: 5 Km ENE From Nafpaktos February, 16 2022 16:06 GMT - 7 minutes ago

Earthquakes Today: Latest Quakes worldwide past 24 hours
 
Strongest quake today: Magnitude 6.2 33 km SW of Santa Lucia Cotzumalguapa, Guatemala - 9 hours ago
The European Mediterranean Seismological Centre said the 6.2 earthquake struck on Wednesday morning in Guatemala, at a depth of 96km, around 40km southwest of Mazatenango
Snip:

A major earthquake measuring 6.2 in magnitude has struck Guatemala reducing buildings to rubble.

The quake hit the Central American nation on Wednesday morning, with the epicentre in Nueva Concepción, the European Mediterranean Seismological Centre (EMSC) said.

It was at a depth of 96 km (60 miles), EMSC said.

The initial tremor was felt at 1.12am local time, before two aftershocks followed at 1.50am and 1.56am, measuring 5 and 4.8, according to reports.

An image of a car having been crushed by falling debris from a collapsing building was taken in Totonicapán city this morning.

While other snaps show rocks having fallen across a road and emergency workers digging through rubble.

Other countries to feel the force were El Salvador and Mexico.

It comes after a so-called earthquake swarm hit Guatemala nation on Sunday, with 15 tremors felt in 24 hours, according to the INSIVUMEH.

They measured between 3.2 and 5 on the Richter scale.

The National Co-ordinator for Disaster Reduction later confirmed there had been no injuries or infrastructure damage.

The swarm struck off the coast of Retalhuleu.

Prior to that, there is understood to have been 15 minor quakes last week in the Pacific Ocean and the coasts of Mexico, El Salvador and Santa Rosa.

Guatemala is exposed to these kinds of natural phenomena due to its location at the convergence of the Caribbean, Cocos and North American tectonic plates, as well as local geological faults.

Another 5.1 magnitude earthquake struck the popular tourist islands of Madeira this morning.

That quake was at a depth of 30 km (18.64 miles), EMSC said and struck near Funchal, on Madeira, part of Portugal.

Many people have reported the terrifying experience of rooms rocking due to the force of the earthquake.

One person tweeted: "I was in my bed and damn it... it was scary. The bed shook all over."


The European Mediterranean Seismological Centre said the 6.2 earthquake struck on Wednesday morning in Guatemala, at a depth of 96km, around 40km southwest of Mazatenango
Snip:


Interesting.

We have the start of a planetary alignment, a CME in the farside of the sun that will be facing earth and a M6.2 earthquake after a moderate earthquake week :headbanger:
 
We have the start of a planetary alignment, a CME in the farside of the sun that will be facing earth and a M6.2 earthquake after a moderate earthquake week :headbanger:

There is currently also an elevated proton flux:

Screenshot_2022-02-17_09-50-05.png

At the end of the year I noticed this rhythm in the Global Seismic Activity Level on volcanodiscovery.
It was only the 4 red bars back then and I wanted to wait some more time before posting, but by now there still seem the be something of a pattern of half a month.
Screenshot_2022-02-17_10-00-31.png
 
Back
Top Bottom