http://notrickszone.com/2017/09/15/as-la-nina-looms-warmists-skid-into-panic-mode-global-warming-pause-set-to-surpass-two-decades/
[...]
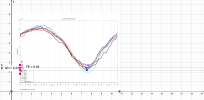
La Nina powers in
The global warming alarmists are in sheer desperation and panic, as made evident by their hysterically shrill reactions to the recent hurricanes. The latest forecast shows a return to La Nina conditions (and a global cool-down).
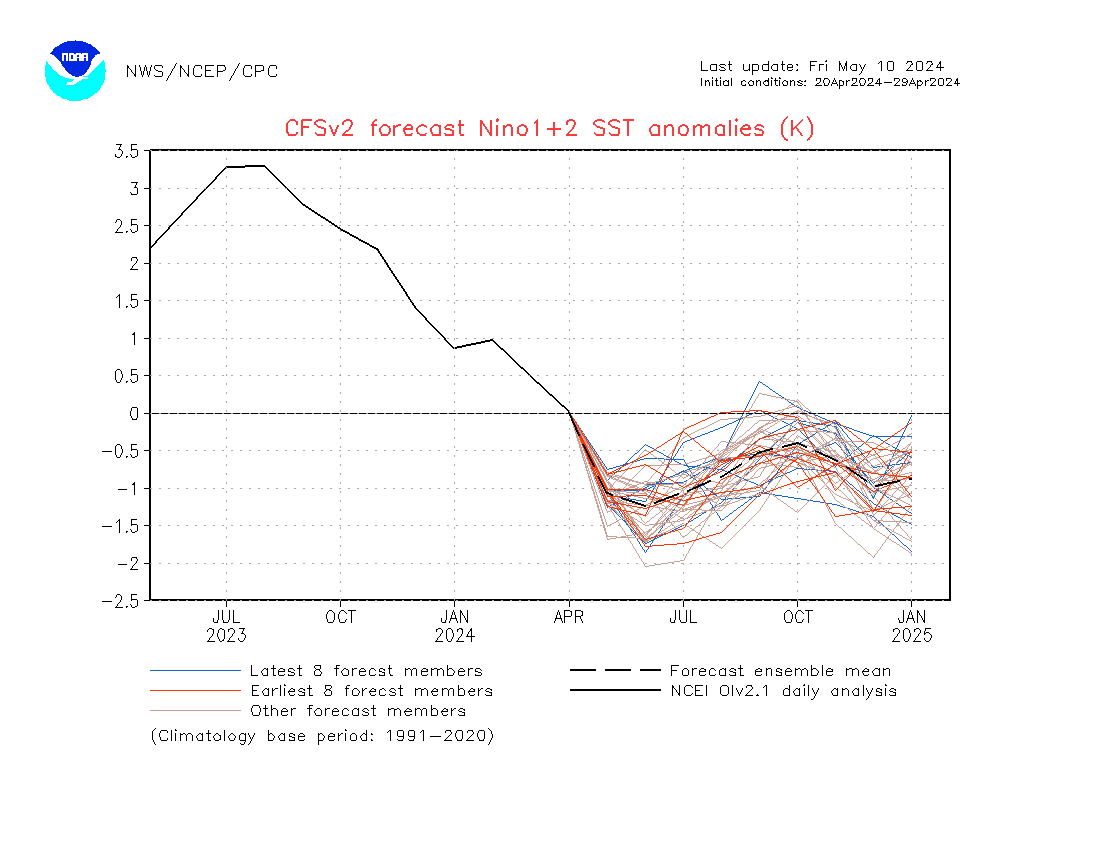
The above chart shows La Nina conditions expected to persist into spring, 2018. This cooling will make itsself evident in satellite data with a lag of about 6 months. This means global temperature will fall even further next year, which means the warming pause will go beyond 20 years.
[...]
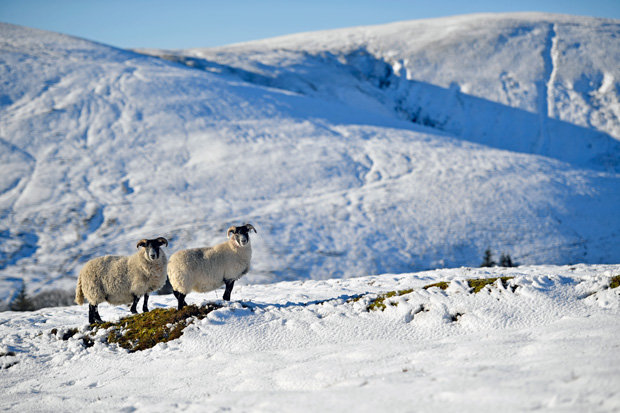
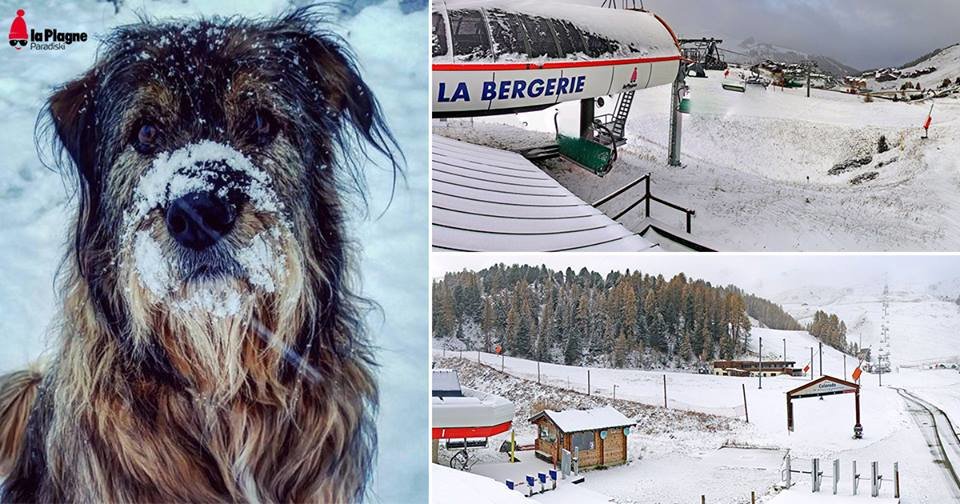
Frigid winter projected for Europe
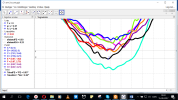
The recent winter projection for Europe issued by Meteociel below shows Europe possiby being gripped by a frigid winter. If the prognosis holds, it could be one of the coldest in years:
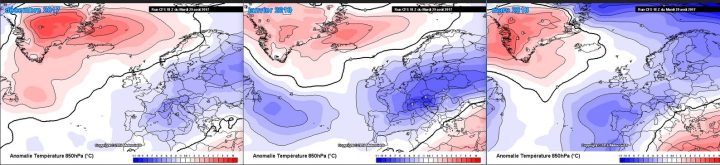
Meteociel/CFS prognosis from 30 August 2017, 850 hPa temperature deviation from the mean (about 1500m) in Europe for the 2017/18 winter. For Europe very icy conditions are expected (from left to right: December, January, February). Source: www.meteociel.fr/php
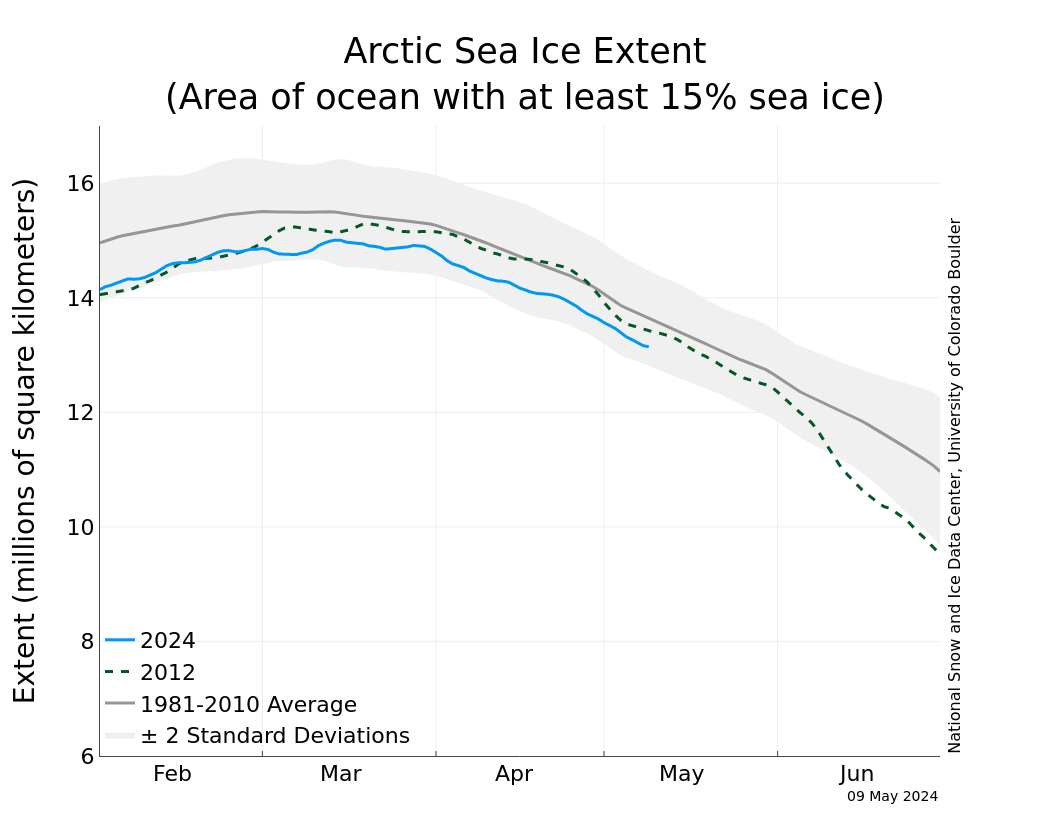
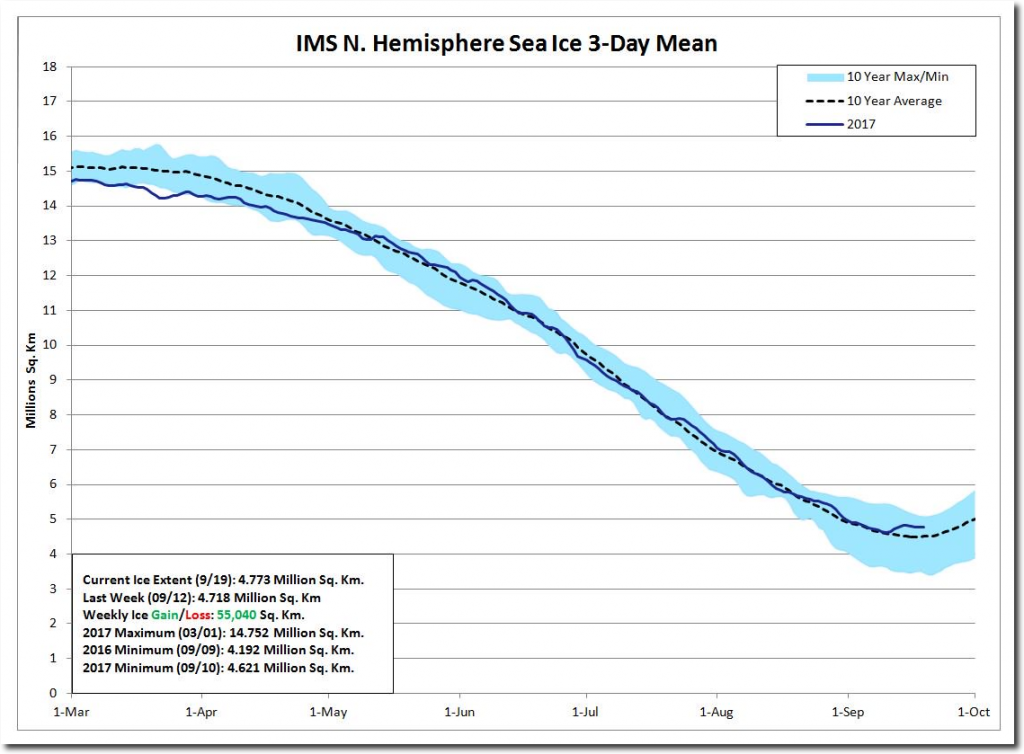
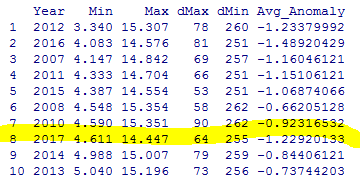
Arctic sea ice rebound
Also the Arctic has shown recovery over the past years. This year’s Arctic sea ice for mid September is about a full 1 million sq. km. over the record low set 5 years ago.

Overall Arctic sea ice has remained stable for the past 10 years, surprising global warming scientists. Source: National Snow and Ice Data center (NSIDC).