The Ice Age Cometh! Forget Global Warming!

FREEZING IN AUGUST: Overnight lows hit 29 in northern Minnesota
http://www.fox9.com/weather/275781204-story

DULUTH, Minn. (KMSP) - Overnight temperatures in northern Minnesota plunged to as low as 29 degrees, according to data collected through Thursday, Aug. 24 by the National Weather Service in Duluth.

Yep, that’s right – freezing temperatures in August. Only in Minnesota.

These are record low temperatures for many areas that typically see average August lows around 50 degrees.

Overnight low temperatures in northern Minnesota

Data valid as of 7:16 a.m. Thursday, Aug. 24 (Source: National Weather Service, Duluth)

13 NE Clear Lake: 29
Crane Lake Airport: 30
Embarrass: 30
5 E Seagull Lake: 30
5 NW Ash Lake: 32
Bruno: 32
International Falls: 33
Grand Marais Airport: 34
5 NW Hovland: 34
Ely Airport: 34
5 S Ely: 34
3 E Orr: 34
3 ENE Margie: 34
Orr: 34
Skibo RAWS: 34
Makinen: 35
1 E Birchdale: 35
7 E Effie: 35
3 SW Orr: 35
 
Today here in the Canberra area it has been cold and rainy. This morning it was minus one degree Celsius, and it rose to plus five max. The rain has been sporadic drizzle. Some of our neighbours a couple of miles away reported snow, which melted as soon as it hit the ground. I've only seen snow here three times in the past 25 years. We're still in winter, but it's chilly. Daffodils are blooming next door!
 
Last days of Russian summer bring snow to Yakutia (Photos)
https://www.rbth.com/arts/lifestyle/2017/08/29/last-days-of-russian-summer-bring-snow-to-yakutia_830630

The first snow has fallen - of the summer or winter? - in Yakutia and the Zabaykalsky Territory (Siberia). Shocked locals rushed to share their photos and on Instagram.
 
15 cm snow in Outer Manchuria, Russia (Instagram photos)

https://www.gismeteo.ru/news/klimat/24854-zima-ne-zhdet-v-priamure-vypalo-15-sm-snega-fotoobzor/
 
Just remembered and looked up that there were multiple examples of it snowing in Russia this past June. Russia is huge, yet that means that July was the only month without snow.

02-22-97
Q: (L) All right, were those given in the order in which they are occurring? The fourth being the one that's coming later?

A: Maybe, but remember this: a change in the speed of the rotation may not be reported while it is imperceptible except by instrumentation. Equator is slightly "wider" than the polar zones. But, this discrepancy is decreasing slowly currently. One change to occur in 21st Century is sudden glacial rebound, over Eurasia first, then North America. Ice ages develop much, much, much faster than thought.

Maybe next year is the year we see snow year round. That is scary thought!
 
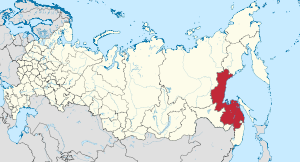
Snow in Khabarovsk Krai, Russia


https://youtu.be/TGhKQKnBn6w


https://youtu.be/TOo6kNnLbF8


300px-Khabarovsk_in_Russia.svg.png
 
Bay Area heat wave: Flex Alert issued for 1 to 10 p.m. (Video/1:03)
PUBLISHED: September 1, 2017 at 5:56 am
_http://www.eastbaytimes.com/2017/09/01/bay-area-weather-scorching-temperatures-will-produce-hottest-days-in-a-decade/?source=email
A record-setting heat wave is poised to unleash its full power Friday and Saturday with temperatures soaring above 110 degrees in some locations — conditions that will likely result in two of the hottest days in at least a decade.

The scorching conditions expected this weekend have already resulted in the cancellation of some events and caused high school officials to cancel or push back start times of football games, and prompted at least one school district, Orinda Union, to shorten its school day Friday.

The scorching conditions expected Friday and Saturday could tie or break Livermore’s all-time record high of 115 degrees, set in 1950. Livermore — one of the Bay Area’s hottest spots — has a forecast high Friday of 114, with 115 expected Saturday. Other expected highs Friday include Concord 112, Gilroy 110, Morgan Hill 109, San Jose (airport) 103, Redwood City 103, Oakland 99 and San Francisco 96.

Gilroy and Livermore have not recorded a 110-plus degree day since 2006.

While the oppressive conditions will be mostly felt inland, folks living closer to the Bay won’t escape the heat.

“We want to stress most locations around the Bay that typically stay cooler will approach the 100-degree mark, places like Hayward, Fremont and Redwood City,”
said Roger Gass, a meteorologist with the weather service. “Typically they see the cooling effects of being close to the Bay. The only relief we see from this event is right along the coastside.”

Even then, Gass said, temperatures along the coast could soar in the 90s.

The California Independent System Operator Corporation issued a voluntary Flex Alert for Friday that calls for sparing use of high-consumption appliances like A/C units and washing machines between 1 p.m. and 10 p.m.

For those who do use air-conditioning, the agency suggests that thermostats should be set at 78 degrees or higher. ISO manages about 80 percent of electricity use in the state.

Temperatures started to climb Thursday, as the mercury hit a new Aug. 31 record in San Rafael of 99 degrees, topping 93 degrees on Aug. 31, 1998, according to the weather service. San Jose was 95 degrees, matching an Aug. 31 record in 1943. It was 90 in Oakland and 86 in San Francisco, both approaching records for the date that have stood more than half a century.

Adding to the scorching temperatures, smoke from wildfires in Northern California and Oregon has arrived in the East Bay and Peninsula, reducing visibility in some places and increasing concentrations of soot.

“The smoke has been moving toward us for several days and now it’s here,”
said Kristine Roselius, a spokeswoman for the Bay Area Air Quality Management District.

Oakland has a “red flag” fire danger warning in effect until at least 8 a.m. Saturday, according to acting Oakland Batallion Fire Chief Frank Tijiboy. He said there will be patrols in the Oakland hills and in what is considered the “mutual threat zone,” from the San Leandro border north to the Berkeley border.

The overall fire danger in the East Bay isn’t made significantly greater by the weekend’s stifling heat, said Ryan Bain, a spokesman for the Contra Costa County Fire Protection District — the area is already a tinder box.

“The low humidity is what kills us, and what makes the fire danger so high,”
Bain said Friday. Both Oakland and Contra Costa County are on high levels of dispatch, with even a report of smoke drawing responses of at least six (Oakland) or five (Contra Costa) engine trucks and crews.

The double whammy of smoke and smog has led the district to issue a Spare the Air alert for what they predict will be unhealthy smog levels on Friday for the Bay Area. And it has prompted cancellation of events, including the Livermore Winegrowers Harvest Festival Harvest, and changed hours of other public and sporting events, and school hours.

The 36th annual Livermore wine festival had been expected to draw 1,000 or more people Sunday afternoon to an outdoor sports field at Las Positas College, but organizers pulled the plug out of concern for the health of visitors and staff.

“Our first priority is the health and welfare of our community,” said Chris Chandler, executive director of the Livermore Valley Winegrowers Association. “The excessive heat forecasted by local and national weather services is a safety risk we are not willing to take.”

Festival tickets will be refunded and the event will not be rescheduled this year, the association said.

Orinda Union School District parents were told Thursday that classes would get out early Friday because of the heat. Four elementary schools were to end their day at 1:55 p.m., and Orinda Intermediate School at 1:05 p.m.

For many, Thursday’s temperatures were smothering.

In Gilroy, where it soared to 98 degrees on Thursday, solar panel installers with Poco Solar Energy in Santa Clara knew to start work extra early, before the roofs got so hot and soft they couldn’t walk on them safely, said Jonathan Gonzalez, the company’s customer relations manager.

Over at the Beaver Creek Smokehouse in Martinez, co-owner Robert Zavatero, 59, posted a note early Thursday afternoon on the restaurant’s door alerting customers that the extreme heat would temporarily cut hours of operation because “our equipment will not work properly when overheated.’’

Meanwhile, state officials are asking all California residents to conserve their power use during peak afternoon and evening hours Friday as they look to keep the state’s power grid humming along over the Labor Day weekend.

Garcia said the heat wave is occurring because of a large area of high pressure from the Pacific Ocean is moving over the region and heading to the Nevada/Utah area. For now, he said, it appears the East Bay is being affected most by the high pressure, and that is the reason Livermore and Walnut Creek are posting triple digit numbers.

“And so we are seeing this area of high pressure act like a heat dome,’’
Garcia said, . explaining that the strength of the high pressure creates a downward motion which can trap the heat and doesn’t allow clouds to form
“So then you just get more sun and heat and sun and heat.’’
Many cities that have had “cooling centers” open on weekdays as a refuge for seniors and residents without air conditioners are extending those hours for at least some of those spots through the holiday weekend. That includes Walnut Creek, where the Civic Park Community Center near downtown will be open from 10 a.m. to 9 p.m. Friday through Sunday.

“Usually we’re open on the weekends for other things, but we’re between (recreation) classes right now,”
said Adriane Lee Bird, the City of Walnut Creek’s recreation manager. “It would have been dark there after 4 p.m. Friday.
“So I don’t think we’ve ever had to pull in staff for this before on a weekend,”
Lee Bird said.

Beyond the standard concerns for outdoors work crews who must keep hydrated, railroads have another worry during hot weather — “sun kinks” of the rails, warped and expanded by the heat, which may lead to rails buckling. This problem has grown as more main line railroads use “welded rail,” quarter-mile sections that are generally more resistant to derailments — except in triple-digit temperatures.

“When extreme heat conditions exist, we increase our track inspections and procedures to identify any heat-related damages before they cause potential issues,”
said Justin Jacobs, a spokesman for Union Pacific, over whose tracks the Bay Area’s many Amtrak trains travel 365 days a year. “In addition to increased inspections, speed reductions may also be implemented during the hottest parts of the day to mitigate heat factors.”

Record heat, lightning, fires, intense rain: California's extreme weather gets wilder
_http://www.latimes.com/local/lanow/la-me-lightning-weather-extreme-heat-20170901-story.html
September 1 2017
The heat wave that has gripped California for a week took a dramatic turn Thursday as lightning storms sparked brush fires, knocked out power to thousands and caused downpours across the region.

Forecasters said the extreme weather will continue through the weekend, with some parts of Northern California flirting with all-time record high temperatures.

Lightning strikes were reported in many areas Thursday, with some sparking a series of brush fires near the 5 Freeway in the Santa Clarita Valley.

In Santa Monica on Thursday evening, city officials asked beachgoers to immediately evacuate all ocean areas and seek cover until the storm ended.

Intense storm cells danced around the region, delivering bursts of heavy rain through the evening.

Residents in Colton lost power Thursday after lightning hit a power substation.

Meanwhile, the record heat continued to tax the power grid.

Los Angeles Department of Water and Power customers used more electricity on Thursday battling the heat wave than has ever been used in the agency’s history, DWP officials announced. Customers hit a peak demand of 6,502 megawatts at 4:15 p.m., shattering the previous record of 6,396 megawatts on Sept. 16, 2014. The agency expects a new record to be set Friday as the heat wave continues.

The California Independent System Operator called for voluntary electricity conservation on Friday.
In Boyle Heights, an estimated 11,000 residents were without power overnight Wednesday as high demand overloaded equipment to the point of failure. Power was restored by 6 a.m.
Thursday, officials said.

Southern California’s heat wave should peak by Friday. But in Northern California, triple-digit temperatures are expected to continue through the Labor Day weekend. That’s worrisome because there are already more than a dozen wildfires burning in the Sierra Nevada, and smoke is settling in the populated valley below.

“The fire, heat and smoke — it’s going to be blech, a hot weekend,”
Bill Rasch of the National Weather Service said from his Bay Area office Thursday.
“It’s miserable up there.”

And it may be unprecedented.

According to UCLA climate scientist Daniel Swain, the heat this weekend may reach levels never before seen in recorded history in some Northern California cities. Sacramento, no stranger to warm summer days, could see a week of 100-degree heat. That’s never happened there in September, the National Weather Service said.

It could be just as brutal in the coastal valley city of Livermore, where the hottest temperature on record is 115 degrees, said Steve Anderson of the National Weather Service. It’s expected to hit 113 degrees there on Friday and 114 degrees on Saturday.

“When we’re approaching all-time record highs, that’s very unusual,”
Anderson said.

The heat wave is part of a larger high-pressure system that has settled over the Great Basin and has been broiling states from California to Utah and Arizona to New Mexico.

The weather pattern is also at least partially responsible for the behavior of Hurricane Harvey in Texas, said Bill Patzert, a climatologist with NASA’s Jet Propulsion Laboratory. The system acted as a barrier that blocked Harvey’s path inland. The storm was stopped in its tracks right over Houston, where it continued sucking up moisture from the Gulf of Mexico and raining it down on the flooded landscape below.
“Until the large-scale pattern changes, it will continue to soak Texas,”
Patzert said.

In California, if a community isn’t prepared for the enduring heat, it can become dangerous. Concord, Santa Rosa and Antioch have opened cooling centers for the weekend.

“So we get into a situation where 110 in the desert isn’t a big deal at all but 110 in one of the coastal valleys is a very big deal indeed. And it affects human health to a considerable degree,
” Rasch said. “They have a very hard time physically when the weather gets that warm.”

Crews battling 16 wildfires in California also have had to cope with the heat along with the excruciating physical demands of the job.

In Butte County, more than 1,100 firefighters who are tackling the Ponderosa fire trudged through rugged woodlands east of Oroville in broiling temperatures, according to the California Department of Forestry and Fire Protection.
“The heat does not work in our favor by any means,”
said Paul Lowenthal, a Cal Fire spokesman.

Fire crews had hoped to make significant gains battling the 3,500-acre blaze overnight, but weather conditions remained hot and dry.

The weather also takes a toll on the state’s infrastructure. The California Independent System Operator’s flex alert on Friday is the fourth this year and the second this week. The message to consumers: Conserve energy.

When temperatures don’t drop at night, people keep their fans and air conditioners on longer, and electrical equipment in the grid doesn’t have a chance to cool. Those issues led to multiple power outages across Southern California this week and caused thousands to lose power in the Bay Area during the last major heat wave in June.

For Southern California, relief could come next week, according to forecasters.The region’s heat advisory expires Saturday, and thunderstorms and cooler temperatures are expected Monday, Swain said.

90

https://www.accuweather.com/en/weather-news/labor-day-forecast-storms-to-rattle-midwest-gulf-coast-west-to-bake-under-record-heat/70002619

9-1-2017

https://youtu.be/WPIwcP_E5Ok?start=31
 
Today is the last day of this meteorological year in terms of the ice sheet surface mass budget for Greenland: _http://www.dmi.dk/en/groenland/maalinger/greenland-ice-sheet-surface-mass-budget/

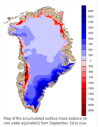
Attached there are three screenshots. In the first, we see that several areas of the coast around Greenland have lost ice mass. These areas are coloured in reddish tones while those that have gained are in blueish tones.

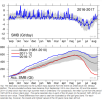
The second picture shows the changes in the ice sheet surface mass from September 1, 2016 to August 31, 2017 measured in Giga tons. Notice that the real decline only began around June 10th and ended two month later, notice also the trend of increase since about August 10.

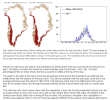
The last picture shows the percentage of the land mass where there has been a melting process going on.

I have been wondering about the coexistence of areas of red, indicating a melting process compared with mostly bluish tones further inland. Perhaps it is due to fairly warm air hitting the coastline and causing melting near the coast. This warm air would contain more moisture than cold air, and as it is pressed up over the ice sheet it cools down and releases its moisture content as snow.

At the beginning of Spring, the blue area, indicating an increase in the ice sheet mass, was almost exclusively in the southeast of Greenland. During the melting season, this "advantage" has not moved much and during the last weeks of August the west and north of Greenland has picked up a good amount of mass, and there is now quite an area where the blue tones dominate. Interestingly, in the northeast of Greenland near the coast there is a decrease in mass. Let us see what happen over the next year.
 

Attachments

  • Accumulated mass Sep 1 2016 to Aug 31, 2017.PNG
    Accumulated mass Sep 1 2016 to Aug 31, 2017.PNG
    80.2 KB · Views: 250
  • Ice developement in Greenland.PNG
    Ice developement in Greenland.PNG
    110.7 KB · Views: 249
  • Percentage of area with ice melting.PNG
    Percentage of area with ice melting.PNG
    101.1 KB · Views: 245
In the previous post I mentioned the information about the Greenlandic ice sheet mass budget from DMI. On their page they also write that;
_http://www.dmi.dk/en/groenland/maalinger/greenland-ice-sheet-surface-mass-budget/ said:
Over the year, it snows more than it melts, but calving of icebergs also adds to the total mass budget of the ice sheet. Satellite observations over the last decade show that the ice sheet is not in balance. The calving loss is greater than the gain from surface mass balance, and Greenland is losing mass at about 200 Gt/yr.
So what about this year that just passed? If in the period 1981-2010, the ice sheet gained close to 400 Gt but in the year 2016-2017 the increase reached close to 600 Gt, then this is 200 Gt above the norm, thus cancelling the 200 Gt of calving that exceeds the gain on the ice sheet. In other words the calving and the amount of snow received should balance for the year 2016-2017.
 
As those who have followed SOTT knows, then Scandinavia has not had much of a summer. I was curious to see what the verdict was from DMI (Danish Meteological Institute) about the Summer 2017. They had this to say:
_http://www.dmi.dk/nyheder/arkiv/nyheder-2017/august/solfattigste-sommer-i-17-aar-vaadeste-i-6/

Sommeren har været kold. Det er sagt mange gange i år. Men faktisk stikker den mere af som 'solfattig' og 'regnfuld'
Danmark har mildt sagt haft en sommer på det jævne i 2017 - ikke mindst sammenlignet med det vi har været vant til i det seneste årti.
Men hvor langt skal vi tilbage, for at finde noget, der var værre? Det har klimatolog Mikael Scharling undersøgt.
Temperaturen siger intet
"Kigger vi på temperaturen - og den har vi hørt meget for - så er det altså kun to år siden, vi havde en koldere sommer. I år ender gennemsnittet på 15,4°C. I 2015 var det nede på 15,2°C".
Gennemsnitstemperaturen siger dog ikke nødvendigvis noget særligt interessant om sommeren. To vidt forskellige udgaver af årstiden kan sagtens ende med det samme resultat.
"En sommer med få skyer har typisk kolde nætter og varme dage. En skyet sommer har derimod smålumre nætter og kølige dage. Begge dele kan resultere i f.eks. 15,4°C, men de to somre vil opleves vidt forskellige", forklarer Mikael Scharling.

which roughly translates as

The summer has been cold. That has been said many times this year. But the summer has actually been more 'lacking in sun' and 'been full of rain'.
Denmark has in other words had an average summer in 2017 - not least when compared to what we have been used to in the last decade.
But how far back do we have to go to find a worse summer? Climatologist Mikael Scharling has looked into it.

The Temperature says nothing.
"When we look at the temperature - and we have had to hear a lot about it - then it is only two years ago, that we had an even colder summer. This year the average was 15,4°C. In 2015 it was down to 15,2°C".
The average temperature doesn't necessarily say much of interest about the summer. Two completely different versions of the season can produce the same result.
"A summer with few clouds typically has colder nights and warmer days. A cloudy summer on the contrary lukewarm nights and cooler days. Both parts can result in for instance 15,4°C, but the two summers will be experienced quite differently", explains Mikael Scharling.

In the above I was waiting for DMI to finally come up with the average temperature so that I could judge how much below normal it was. Instead DMI comes up with what I consider at distraction story by saying that the temperature means nothing and how it really isn't that special as it only was two years since Denmark had a cooler temperature. So DMI didn't mention what the average is for the season.

So, I decided to find the answer by going to the pre season story, where the averages are given for rain, amount of sun hours, and temperature.

_http://www.dmi.dk/nyheder/arkiv/nyheder-2017/juni/saadan-er-sommeren/

There it showed that during the summers 1961-1990, the average temperature was 15,2°C.
During the period of (2006-2015) the average temperature was 16,1°C.

First DMI has reverted back to the 30 year period from 1961-1990 as their base line. They say here: _http://www.dmi.dk/vejr/arkiver/normaler-og-ekstremer/klimanormaler-dk/ that this period is according to the UN's international meteorological agency WMO, the recommended climate normals.

But is this true:
_https://public.wmo.int/en/media/news/new-two-tier-approach-“climate-normals”
The World Meteorological Congress, WMO’s top decision-making body on Standards, approved a resolution that WMO will update the climatological Standard Normals for operational purposes every 10 years and will use 1981-2010 as the current base period. However, it will retain 1961-1990 as the historical base period for the sake of supporting long-term climate change assessments.

So it appears as if DMI is not being totally honest here, also because only a few years ago, then did use the new baseline of 1981-2010. It appears as if it is more of trying to 'hide the decline'. What WMO says, it that the old base line will be used as a historical baseline for climate change assessment.

Even if we don't any longer have the figures from DMI about the baseline from 1981-2010, then they give us the period from 2006-2015 and here it was 16,1°C.

So the short of the story is that the Danish summer was 0.7°C. colder than the period 2006-2015, which would be interesting in and of itself. The fact that it only was in 2015 that the summer was colder than this year with 0.9°C below average, should be even more news worthy as that means that 2 out the last 3 summers in Denmark have been substantially below the preceding decade. Now THAT I find news worthy as such figures could signal a more disturbing trend, not least since we just have come down from the big El Nino event which has a certain lag time.. So the temperatures should have been expected to be higher not lower than the average. DMI is known for having changed their methodology to fit more the version of Global warming and 'hide the decline. This could just be an example of that.
 
New findings published today in the Proceedings of the National Academy of Sciences of the United States of America (PNAS) by Desert Research Institute (DRI) Professor Joseph R. McConnell, Ph.D., and colleagues document a 192-year series of volcanic eruptions in Antarctica that coincided with accelerated deglaciation about 17,700 years ago.

Massive Antarctic volcanic eruptions linked to abrupt Southern hemisphere climate changes September 4, 2017
https://phys.org/news/2017-09-massive-antarctic-volcanic-eruptions-linked.html

"Detailed chemical measurements in Antarctic ice cores show that massive, halogen-rich eruptions from the West Antarctic Mt. Takahe volcano coincided exactly with the onset of the most rapid, widespread climate change in the Southern Hemisphere during the end of the last ice age and the start of increasing global greenhouse gas concentrations," according to McConnell, who leads DRI's ultra-trace chemical ice core analytical laboratory.

Climate changes that began ~17,700 years ago included a sudden poleward shift in westerly winds encircling Antarctica with corresponding changes in sea ice extent, ocean circulation, and ventilation of the deep ocean. Evidence of these changes is found in many parts of the Southern Hemisphere and in different paleoclimate archives, but what prompted these changes has remained largely unexplained.

"We know that rapid climate change at this time was primed by changes in solar insolation and the Northern Hemisphere ice sheets," explained McConnell. "Glacial and interglacial cycles are driven by the sun and Earth orbital parameters that impact solar insolation (intensity of the sun's rays) as well as by changes in the continental ice sheets and greenhouse gas concentrations."

"We postulate that these halogen-rich eruptions created a stratospheric ozone hole over Antarctica that, analogous to the modern ozone hole, led to large-scale changes in atmospheric circulation and hydroclimate throughout the Southern Hemisphere," he added. "Although the climate system already was primed for the switch, we argue that these changes initiated the shift from a largely glacial to a largely interglacial climate state. The probability that this was just a coincidence is negligible."

Furthermore, the fallout from these eruptions - containing elevated levels of hydrofluoric acid and toxic heavy metals - extended at least 2,800 kilometers from Mt. Takahe and likely reached southern South America.

How Were These Massive Antarctic Volcanic Eruptions Discovered and Verified?

McConnell's ice core laboratory enables high-resolution measurements of ice cores extracted from remote regions of the Earth, such as Greenland and Antarctica. One such ice core, known as the West Antarctic Ice Sheet Divide (WAIS Divide) core was drilled to a depth of more than two miles (3,405 meters), and much of it was analyzed in the DRI Ultra-Trace Laboratory for more than 30 different elements and chemical species.

Additional analyses and modeling studies critical to support the authors' findings were made by collaborating institutions around the U.S. and world.

"These precise, high-resolution records illustrate that the chemical anomaly observed in the WAIS Divide ice core was the result of a series of eruptions of Mt. Takahe located 350 kilometers to the north," explained Monica Arienzo, Ph.D., an assistant research professor of hydrology at DRI who runs the mass spectrometers that enable measurement of these elements to as low as parts per quadrillion (the equivalent of 1 gram in 1,000,000,000,000,000 grams).

"No other such long-lasting record was found in the 68,000-year WAIS Divide record," notes Michael Sigl, Ph.D., who first observed the anomaly during chemical analysis of the core. "Imagine the environmental, societal, and economic impacts if a series of modern explosive eruptions persisted for four or five generations in the lower latitudes or in the Northern Hemisphere where most of us live!"

Discovery of this unique event in the WAIS Divide record was not the first indication of a chemical anomaly occurring ~17,700 years ago.

"The anomaly was detected in much more limited measurements of the Byrd ice core in the 1990s," notes McConnell, "but exactly what it was or what created it wasn't clear. Most previous Antarctic ice core records have not included many of the elements and chemical species that we study, such as heavy metals and rare earth elements, that characterize the anomaly - so in many ways these other studies were blind to the Mt. Takahe event."

DRI's initial findings were confirmed by analysis of replicate samples from WAIS Divide, producing nearly identical results.

"We also found the chemical anomaly in ice from two other Antarctic ice cores including archived samples from the Byrd Core available from the University of Copenhagen and ice from Taylor Glacier in the Antarctic Dry Valleys," said Nathan Chellman, a graduate student working in McConnell's laboratory.

Extraction of the WAIS-Divide ice core and analysis in DRI's laboratory were funded by the U.S. National Science Foundation (NSF).

"The WAIS Divide ice core allows us to identify each of the past 30,000 years of snowfall in individual layers of ice, thus enabling detailed examination of conditions during deglaciation," said Paul Cutler, NSF Polar Programs' glaciology program manager. "The value of the WAIS Divide core as a high-resolution climate record is clear in these latest results and is another reward for the eight-year effort to obtain it."
 
Re: Solar activity to fall by 60% in 2030-40?

I thought this was interesting since this thread started on July 12, 2015 and this is the most recent solar flare.

Posted by TW on September 06, 2017 in categories Featured articles, Solar activity

A major X-class solar flare erupted from geoeffective Active Region 2673 peaking as X9.3 at 12:02 UTC on September 6, 2017. The event started at 11:53, peaked at 12:02 and ended at 12:10 UTC. This is the second X-class solar flare of the day. It comes just hours after a long-duration X2.2 at 09:33 UTC. It is also the strongest solar flare of the current solar cycle (Solar Cycle 24).

Radio signatures suggest a strong Coronal Mass Ejection (CME) was produced during this event. The location of this region favors Earth-directed CMEs.

The event was associated with a Type IV and Type II (estimated velocity 1969 km/s) radio emission. Type II emissions occur in association with eruptions on the sun and typically indicate a coronal mass ejection is associated with a flare event. Type IV emissions occur in association with major eruptions on the sun and are typically associated with strong coronal mass ejections and solar radiation storms.

In addition, this impressive event was associated with a 10cm Radio Burst lasting 3 minutes with peak flux of 12000 sfu.

Today's X9.3 is the strongest solar flare of Solar Cycle 24. Although X-class solar flares were expected (25% chance) since Region 2673 rapidly grew into a monster region and attained 'beta-gamma-delta' magnetic configuration, such powerful flare comes as a huge surprise, as our star is heading toward Solar Minimum. The previous record for the strongest flare of the cycle was X6.9 of August 9, 2011.

The cycle has so far had 47 X-class flares, including today's X2.2 and X9.3.

The last time our star erupted with an X-class flare was on May 5, 2015 - X2.7. CME was produced, but the location didn't favor Earth-directed CMEs.

The location of Active Region 2673 favors Earth-directed CMEs. However, analysis of the event is still in progress.

CME produced by M5.5 solar flare on September 4, 2017 is heading toward Earth and is expected to arrive later today (September 6). A G3 - Strong geomagnetic storm watch is in effect for September 6 and 7.

WSA-Enlil model below shows both CMEs (September 4th and 6th). The September 6th CME is expected to arrive late September 8.
 
Apocalyptic September? Here Is A List Of 27 Major Disasters That Have Already Happened So Far This Month
http://theeconomiccollapseblog.com/archives/apocalyptic-september-here-is-a-list-of-27-major-disasters-that-have-already-happened-so-far-this-month

Two major hurricanes, unprecedented earthquake swarms and wildfires roaring out of control all over the northwest United States – what else will go wrong next? When I originally pointed to the month of September as a critical time, I had no idea that we would see so many catastrophic natural disasters during this time frame as well. Hurricane Harvey just broke the all-time record for rainfall in the continental United States, Hurricane Irma is so immensely powerful that it has been called “a lawnmower from the sky”, vast stretches of our country out west are literally being consumed by fire, and the magnitude-8.2 earthquake that just hit Mexico was completely unexpected. As I have stated so many times before, our planet is becoming increasingly unstable, but most people simply do not understand what is happening.

My good friend Zach Drew is getting married next month, and I would encourage everyone to go wish him well on Facebook. On Friday, he posted the best summary of the major disasters that we have been experiencing so far this month that I have seen anywhere…

* California is on fire.
* Oregon is on fire.
* Washington is on fire.
* British Columbia is on fire.
* Alberta is on fire
* Montana is on fire.
* Nova Scotia is on fire.
* Greece is on fire.
* Brazil is on fire.
* Portugal is on fire.
* Algeria is on fire.
* Tunisia is on fire.
* Greenland is on fire.
* The Sakha Republic of Russia is on fire.
* Siberia is on fire.
* Texas is under water

* India, Nepal, Pakistan, and Bangladesh, experience record monsoons and massive death toll.
* Sierra Leone and Niger experience massive floods, mudslides, and deaths in the thousands.

* Italy, France, Spain, Switzerland, Hungary, Poland, Romania, Bosnia, Croatia, and Serbia are crushed in the death grip of a triple digit heat wave, dubbed Lucifer.

* Southern California continues to swelter under triple digit heat that shows no sign of letting up.

* In usually chilly August, the city of San Francisco shatters all-time record at 106 degrees, while it reaches 115 degrees south of the city. Northern California continues to bake in the triple digits.

(()) Yellowstone volcano is hit with earthquake swarm of over 2,300 tremors since June, recording a 4.4 quake on June 15, 20017 and 3.3 shaker on August 21, 2017.
(()) 5.3 earthquake rumbles through Idaho
(()) Japan earthquake 6.1 possible tsunami..
(()) Mexico earthquake 8.2 imminent tsunami. Beach lines are receded at least 50+ meters

* Hurricanes Harvey, Irma (biggest ever recorded), Jose and Katia are barreling around the Atlantic with 8 more potentials forming

* And last but not least an X10 C.M.E solar flare two nights ago. The highest recorded solar flare ever!

*****

For much more from Zach, you can follow his work regularly at TruNews.com.

Some are describing what is happening to us as a “perfect storm”, and they are wondering if even more major disasters are coming in the very near future.

Let us hope not, because there is a tremendous amount of concern that we may not be able to pay for the disasters that have happened already. The following comes from Politico…

Harvey and Irma could be a breaking point. At $556 billion, the Houston metropolitan area’s economy is bigger than Sweden’s. New Jersey could easily fit inside the region’s sprawling footprint, where Harvey dumped 34 trillion gallons of water, as much as the three costliest floods in Texas history combined. The Harvey response alone eventually could double the $136 billion in government aid spent after Hurricane Katrina flooded New Orleans.

And as of Friday, an estimated $1.73 trillion worth of real estate was in the path of Irma’s hurricane-force winds, according to the University of Wisconsin’s Cooperative Institute for Meteorological Satellite Studies.

We won’t know the true extent of the damage that has been caused down in Florida for many days, but we do know that much of the state is already without power…

More than 3.3 million homes and businesses and counting have lost power in Florida as Hurricane Irma moves up the peninsula. The widespread outages stretch from the Florida Keys all the way into central Florida. Florida Power & Light, the state’s largest electric utility, said there were nearly 1 million customers without power in Miami-Dade County alone. The power outages are expected to increase as the storm edges further north. There are roughly 7 million residential customers in the state.

In the end, the federal government will likely step in and spend a lot of money that it does not have to rebuild and restore the communities that Hurricane Harvey and Hurricane Irma have destroyed.

But we are already 20 trillion dollars in debt, and it is being projected that we will continue to add another trillion dollars to that total every year for the foreseeable future.

At some point all of this debt will simply become completely unsustainable.

Of course the major disasters will just inevitably keep on coming. As Politico has pointed out, major natural disasters seem to just keep on getting bigger, and they seem to be hitting us more frequently than in the past…

The disasters are arriving with greater frequency. Counting Harvey, the U.S. this year has experienced 10 weather-related events each costing $1 billion or more. The country averaged fewer than six big-dollar storms, flood, fires and freezes a year between 1980 and 2016, according to the National Oceanic and Atmospheric Administration. Between 2012 and 2016, however, weather catastrophes occurred almost twice as often.

I know that I have been writing about these hurricanes a lot in recent weeks, and I promise to get back to focusing on the economy in the days to come.

But it is absolutely imperative that we all begin to understand that something has fundamentally changed. Our world has become much less stable, and
“apocalyptic events” are starting to hit us one after another.
 
Aeneas, your investigation write-up would make a good sott article with just a tiny bit of polishing.
 
Back
Top Bottom