Hello,
I was wondering about something I had received a few years back, because it relates somewhat to the issue of hidden technology.
The issue in question came from a mail order solicitation I received from a financial newsletter/investment club. It had revealed that in
its research, in U.S. stock market history as far back as 1800, every 50 years in America a transportation revolution had occurred.
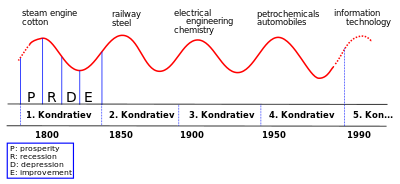
You can graph an index of prices of a sector and observe on this graph, using data from all related companies of this type of technology,
a curve that looks like an elongated "S"; hence the term "S" curve, more like a Sigmoid function curve or an error term function.
Graphing these stocks, we find that the dominant transport method in the early 1800s were canals. For the next 50 years, the stock
prices of anything to do with canals had this "S" curve shape. Then the same thing occurred for railroads and related stocks, starting
in the 1850s and a 50-year "S" curve. Then in 1900 came automobiles. In 1950 came jet airliners.
And the year 2000? Nothing. Yet something SHOULD be there.
This suggest to me that some technology related to space travel - what I think is the next transportation revolution - is being suppressed,
because there should be an "S" curve taking shape for such types of stocks in the stock market, yet how many aerospace companies do
we know of today?
As I am not a mathematician, is there somebody out there who can look into this and verify my suspicions?
Edward JS
I was wondering about something I had received a few years back, because it relates somewhat to the issue of hidden technology.
The issue in question came from a mail order solicitation I received from a financial newsletter/investment club. It had revealed that in
its research, in U.S. stock market history as far back as 1800, every 50 years in America a transportation revolution had occurred.
You can graph an index of prices of a sector and observe on this graph, using data from all related companies of this type of technology,
a curve that looks like an elongated "S"; hence the term "S" curve, more like a Sigmoid function curve or an error term function.
Graphing these stocks, we find that the dominant transport method in the early 1800s were canals. For the next 50 years, the stock
prices of anything to do with canals had this "S" curve shape. Then the same thing occurred for railroads and related stocks, starting
in the 1850s and a 50-year "S" curve. Then in 1900 came automobiles. In 1950 came jet airliners.
And the year 2000? Nothing. Yet something SHOULD be there.
This suggest to me that some technology related to space travel - what I think is the next transportation revolution - is being suppressed,
because there should be an "S" curve taking shape for such types of stocks in the stock market, yet how many aerospace companies do
we know of today?
As I am not a mathematician, is there somebody out there who can look into this and verify my suspicions?
Edward JS