The Ice Age Cometh! Forget Global Warming!

From the latest Suspicious 0bservers video (March 16th), I found these two maps to be telling quite the tale.

The first is the mainstream interpretation of weather data, apparently using climate variability of the 1800's as a base (according to Ben Davidson), which distorts the average temperatures. I checked on the NOAA website, and sure enough:

  • Earth’s temperature has risen by 0.14° F (0.08° C) per decade since 1880, and the rate of warming over the past 40 years is more than twice that: 0.32° F (0.18° C) per decade since 1981.

So this makes things look rather warm.

Screen Shot 2022-03-16 at 3.57.32 PM.png

When a different data presentation is used, based on more recent average temperatures (1991-2020), this is what occurs on the map:

Screen Shot 2022-03-16 at 3.57.37 PM.png

In this presentation, things are looking frosty in North America, Central Africa, China and Australia. I can't help but notice someone turned up the heat over Moscow...
 
From the latest Suspicious 0bservers video (March 16th), I found these two maps to be telling quite the tale.

The first is the mainstream interpretation of weather data, apparently using climate variability of the 1800's as a base (according to Ben Davidson), which distorts the average temperatures. I checked on the NOAA website, and sure enough:
So this makes things look rather warm.

View attachment 56684

When a different data presentation is used, based on more recent average temperatures (1991-2020), this is what occurs on the map:

View attachment 56685

In this presentation, things are looking frosty in North America, Central Africa, China and Australia. I can't help but notice someone turned up the heat over Moscow...

I read two years ago (i believe it was at notrickszone.com), about comparisons between various, global temperature deviation maps (present and recent past), how deceiving those can be.

E.g. the coarse grid is very sloppy and will bundle countries and regions together as if they all are (for example) too warm. And in comparison with a much finer grid, you spot interesting deviations where some areas can be colder than normal (but are not shown in maps with too coarse grids).

Of course maps who go back 100 years become even more sloppy than sloppy due to the extreme thin weather observation network around the world back then.

Surprise :lol:
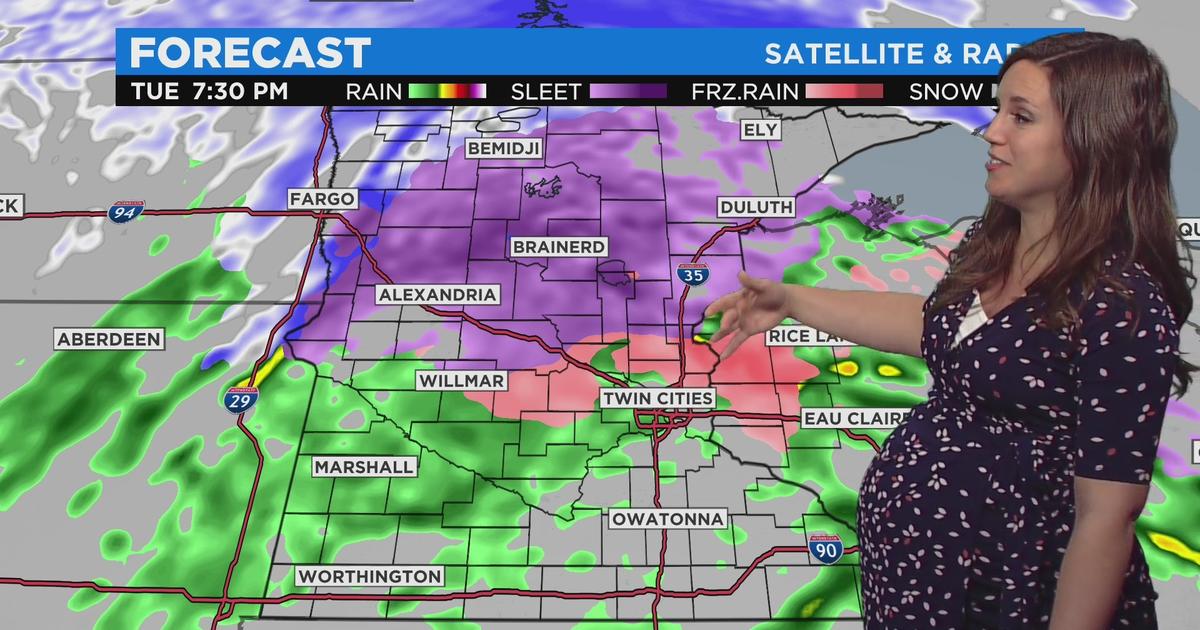
: Usually the finer grid maps of modern climate - are not that often used in popular articles about our climate.

So, NOAA charts etc, need to be seen with some caution. Didn’t they also change temperature series over time in order to fit the climate change agenda ?
 
Tony Heller's explains the data - Cherry Picking Antarctica - Rumble

I love your reference to Tony Heller, Vulcan59 !

Because as I just read JEEP’s entry about the spectacular warming over Antarctica - - my first thought that flashed into my mind was… I wonder if Tony Heller might have written about It, too. And BAM, he did !

Setting the records straight, explaining that what looks so deep red, isn’t so warm after all (at -30°C), putting things straight. Great guy, this Tony Heller. I’ve been following him since 2016/17. He is incredible in explaining and puncturing official advertising scams revolving climate, weather and sea levels.

It was several years ago I believe, when Swedish politicians where officially stating that the warming over Greenland and North Pole had become so extreme during winter… but completely failed to mention / to show / that even if the weather can be “milder” at times during winter, the temperatures were still way below freezing. So, no melting during winter… Kind of the same phenomena over Antartica right now, failing to tell the public, that the temperatures are, no matter deviation, still a whopping -30°C.
 
Tony Heller's explains the data
It should be noted that the person who posted the youtube absolutely doesn't associate the spike as being ACC or AGW and gives his ideas of what's happening starting at 0:43. He discusses the "scientific" data released and rejects the human caused climate change conclusion, but probably doesn't suspect that the data could be falsified. He may think the scientists are wrong but not that they are conniving liars. Nonetheless, the second map posted by @iamthatis shows more spots of above average temps than those of below average temps with an eastern area showing the warmest above average temps - not sure if that's the same area with the spike:

screen-shot-2022-03-16-at-3-57-37-pm-png.56685


I'm inclined to believe volcanic activity is responsible for the spike. And Tony Heller is hilarious - gotta love his debunking! :lol:

Apparently in previous cold times, not every region on the planet becomes cold. The cold is not a uniform phenomenon. Some areas even warm up, according to this article by Cap Allon:

Also not addressed is NASA’s longstanding research showing that while Earth’s overall temperature trends colder during prolonged bouts of low solar activity (such as today’s descent into the next Grand Solar Minimum, which likely commenced during Solar Cycle 24), not all regions experience the chill. As visualized in NASA’s ‘Maunder Minimum Reconstruction Map’ (shown below), areas such as the Arctic, Alaska and the North Atlantic actually warm during spells of otherwise ‘global’ cooling.

Temp change between 1780 (a year of normal solar activity) and 1680 (a year within the depths of the Maunder Minimum) — NASA.

So the big red zone over Moscow (in the NOAA global temp map posted above) has an historic precedent, according to Cap Allon. The difference is that the warm spot during the Maunder Minimum was over the North Atlantic. Now it appears to be over Moscow. I wonder if that pattern will remain stable as the ice age deepens?

About the Antarctic temp spike, I noticed that in the NOAA map that there is no data showing for the Arctic and Antarctic. They are simply grey. No data. Ya think that keeping track of the polar regions and reporting on them would be in their interest, no? No, no, forget about the polar regions, just enjoy been driven by your electric car to the local bug-burger and think anti-Russian thoughts...
 
Setting the records straight, explaining that what looks so deep red, isn’t so warm after all (at -30°C), putting things straight. Great guy, this Tony Heller. I’ve been following him since 2016/17. He is incredible in explaining and puncturing official advertising scams revolving climate, weather and sea levels.
I still think it's something that should not be dismissed (not that I'm saying you are doing that, but maybe Heller). As this tweet points out, temperature records are being broken by huge margins, which are definitely anomalies:
 
The cold is not a uniform phenomenon.

"Earth’s overall temperature trends colder during prolonged bouts of low solar activity (such as today’s descent into the next Grand Solar Minimum, which likely commenced during Solar Cycle 24)"
The accompanying map has all of the US in blue with Ohio and NC dark blue! The midwest bread basket along with California, Texas, and Florida won't be providing food like they used to. Will Alaska have to be stepped up for food production? The environmentalists will be going nuts!
 
You are right Beau

in what you point out - and no I didn’t truly intend to dismiss all of it. Realizing that when i re-read my style of expression, it sounded as if i ignored all of it. I meant by soul, that Tony Heller took the edge out of the spectacularism; e.g. shaved off what was over the top.

While it still is interesting to investigste, what exactly caused record temperatures to occur over parts of the Antartica !
 
New data but still referencing CO2:

Ice cores drilled in Antarctica, Greenland reveal scores of gigantic volcanic eruptions during Ice Age

Ice cores drilled in Antarctica and Greenland have shown colossal volcanic eruptions during the Ice Age, with many of them bigger than any eruption in modern history.

According to the University of Copenhagen physicists who were responsible for the research, these ancient eruptions “can teach us about our planet’s sensitivity to Earth change.”

For most people, the mention of a volcanic eruption evokes doomsday story lines that include roaring explosions, dark ash puffing up into the stratosphere and gooey lava covering everything in its way as terrified humans run for their lives.

While such an eruption could hypothetically happen any time, people have had to settle with disaster films and books when it comes to truly enormous volcanic eruptions in the modern age.

“We haven’t experienced any of history’s largest volcanic eruptions. We can see that now. Eyjafjellajökull, which paralyzed European air traffic in 2010, pales in comparison to the eruptions we identified further back in time. Many of these were larger than any eruption over the last 2,500 years,” said Anders Svensson of the University of Copenhagen‘s Niels Bohr Institute.

Svensson and his fellow researchers managed to evaluate the quantity and intensity of volcanic eruptions over the last 60,000 years by analyzing ice cores drilled in Antarctica and Greenland. Estimates of volcanic eruptions more than 2,500 years ago have been linked with great doubt and a lack of accuracy up to now.

The researchers were able to identify 85 of the volcanic eruptions as large global eruptions with 69 of them estimated to be bigger than the 1815 eruption of Mount Tambora in Indonesia, the largest volcanic eruption in recorded human history.

The Tambora eruption discharged so many sulfuric acid into the stratosphere that it blocked sunlight and caused global cooling in the following years. The eruption also brought tsunamis, drought, famine and no less than 80,000 deaths.

“To reconstruct ancient volcanic eruptions, ice cores offer a few advantages over other methods. Whenever a really large eruption occurs, sulfuric acid is ejected into the upper atmosphere, which is then distributed globally – including onto Greenland and Antarctica. We can estimate the size of an eruption by looking at the amount of sulfuric acid that has fallen,” Svensson explained.

In a prior study, the researchers managed to coordinate ice cores from Antarctica and Greenland to date the respective core layers on the same time scale. By doing this, they were able to compare sulfur residues in ice and understand when sulfuric acid spread to both poles after worldwide important eruptions.

“The new 60,000-year timeline of volcanic eruptions supplies us with better statistics than ever before. Now we can see that many more of these great eruptions occurred during the prehistoric Ice Age than in modern times. Because large eruptions are relatively rare, a long timeline is needed to know when they occur. That is what we now have,” said Svensson.

And people may now be wondering when the next of these gigantic eruptions will happen. Svensson isn’t ready to make any predictions.

“Three eruptions of the largest known category occurred during the entire period we studied, so-called VEI-8 eruptions. So, we can expect more at some point, but we just don’t know if that will be in a hundred or a few thousand years. Tambora-sized eruptions appear to erupt once or twice every thousand years, so the wait for that may be shorter,” said Svensson.

Powerful volcanic eruptions can change global climate as there is usually a five to 10-year cooling period that follows. For this reason, there is a great deal of interest in mapping the significant eruptions of the past since they can assist scientists to look into the future.

“Ice cores contain information about temperatures before and after the eruptions, which allows us to calculate the effect on climate. As large eruptions tell us a lot about how sensitive our planet is to changes in the climate system, they can be useful for climate predictions,” Svensson explained.

Deciding the Earth’s climate sensitivity is an Achilles’ heel of modern climate models.

“The current IPCC [Intergovernmental Panel on Climate Change] models do not have a firm grasp of climate sensitivity that is what the effect of a doubling of CO2 in the atmosphere will be. Vulcanism can supply us with answers as to how much temperature changes when Earth’s atmospheric radiation budget changes, whether due to CO2 or a blanket of sulfur particles. So, when we have estimated the effects of large volcanic eruptions on climate, we will be able to use the result to improve climate models,” Svensson said.

Overall, the researchers were able to identify 1,113 volcanic eruptions in Greenlandic ice cores and 740 eruptions in Antarctic ice cores over the last 60,000 years, where cores had sulfuric acid deposits higher than 20kg and 10kg per square kilometer, respectively

Eighty-five of the eruptions identified were discovered by researchers at both of Earth’s poles. Twenty-five of these were bigger than any eruption in the past 2,500 years. The latest study was published in the journal Climate of the Past.
 
Sunday, Mar. 27, 2022
HELIOSEISMIC SUNSPOT ALERT: Researchers who use helioseismology to monitor the farside of the sun have detected echoes from a potentially significant sunspot group. It's right here. The active region, whatever it is, will rotate into view early next week. Solar flare alerts: SMS Text.

GEOMAGNETIC STORM WATCH (G1-CLASS): A CME is heading for Earth. Minor G1-class storms are possible when the storm cloud arrives on March 27-28. Coronagraphs onboard the Solar and Heliospheric Observatory (SOHO) made this movie as the CME left the sun on March 25th:​

cme_c3_anim.gif

The CME is faint, but it is moving fast (959 km/s) squarely inside the Earth strike zone. It could deliver a sharp blow to our planet's magnetic field despite its low luminosity in the coronagraph movie.

NASA analysts have modeled the CME's trajectory. Note the yellow dot in the animation below. That's Earth.​


If NASA's model is correct, the CME will miss Venus on March 27th before hitting Earth around 0 hours UT on March 28th. For observers in North America, this means the geomagnetic storm could begin after local nightfall on Sunday, March 27th. Photographic auroras could descend into northern-tier US states from Maine to Washington. Aurora alerts: SMS Text.

Note: This is a good time of year for aurora watchers. During weeks around equinoxes, cracks form in Earth's magnetic field, allowing solar wind to enter. Even a weak CME impact can spark a good display at high latitudes. Researchers call it the "Russell-McPherron effect," and it could boost the effectiveness of the incoming CME.​


1648350174130.jpeg

Saharan dust turns seaside Spanish town brown

Published Mar. 26, 2022 7:55 AM PDT


4.7 Earthquake Oregon Coast.. Saturday night update.. 3/26/2022
TheEarthMaster Mar 26, 2022 RT / 14:15

End snip: By WCCO-TV Staff March 26, 2022 at 8:20 pm
According to forecasters, the storm will bring a one-two punch, with the first wave hitting Tuesday, bringing rain to southern Minnesota and snow to the Northland. A wintry mix could also fall across central Minnesota.

The second wave looks to hit Wednesday and last through Thursday evening, bringing more widespread sleet and snow. Again, however, it’s too soon to tell exactly what will fall where.

WCCO-TV meteorologists say that plowable snow will most likely fall across northern and western Minnesota. Whether or not the metro area will see plowable snow is less certain.

Other issues to consider with this system will be icing and flooding.

Before the storm, Sunday will be sunny and cool, with daytime highs only barely climbing above freezing. Those heading out to morning church services will want to bundle up, as the wind will make it feel like zero degrees in the Twin Cities.

Temperatures look to bounce back into the mid-40s on Monday. That’s about average for this time of year. Tuesday will bring clouds and patchy showers before the storm system hits.
 

NEWS WEATHER Freeze: which agricultural regions will be most at risk?
France By Cyril BONNEFOY, meteorologist Published on 30/03/22, updated on 01/04/22 at 13:10

The concern is confirmed for the agricultural profession since the frosts will make their comeback this weekend and especially Monday which will be the coldest morning. Here is the update of our forecast this Friday.

650x370_100_300_000000x30x0.jpg

Credit: The Weather Channel

The weather changes drastically this weekend after several days of mild spring. We will move from temperatures worthy of a month of May last Monday to temperatures of February this weekend. The risk of frost will increase from Saturday to Next Monday or even Tuesday for some regions, raising fears of much damage to fruit and wine crops.

Frosts in accentuation Sunday and Monday

With the evacuation of the depression, responsible for the snow disturbance, towards the Gulf of Genoa, the thinning quickly returns in the night from Friday to Saturday on the northwest. Nevertheless, the north wind blows, even if it is less strong than Friday during the day. This prevents temperatures from dropping too low below 0°C. Some light frosts will nevertheless be possible, west of a Paris-La Rochelle line. In the east and south, the clouds are still very numerous, this prevents any radiation and thus limits the drop in night temperatures. On Sunday, the sky continues to clear, over the entire northern and western half. On these regions the minimum temperatures decrease compared to the day before with -3 to -1 ° C on average, locally less. Frosts are more limited on the center-east, due to clouds. Finally, Monday is the most feared day on the central-eastern regions with a possibility of severe frosts (<-5 ° C). However, milder air would quickly arrive on the Channel coast with the approach of a disturbance and the shift of the flow to the west.

News France

Credit: The Weather Channel
Risks of strong damage in arboriculture, more moderate for the vine

Fruit trees have started in most regions, after a particularly mild end of March. Cherry, apricot, peach and plum trees will be particularly exposed to the risk of frost and to a lesser extent apple and pear trees a little less advanced. It is thus all the regions that will be exposed to a risk of damage, more particularly the departments south of a Nantes-Charleville-Mézières line.

News France

Credit: The Weather Channel

The frost which is returning after a period of remarkable mildness this month of March, should cause significant damage in the arboreal domain, in particular on the plum, peach, cherry and apricot trees, already in flower for most regions. Nevertheless, the risk should be lower this year for the vines due to less advanced vegetation, except in Burgundy. It should be noted that the thaw will prevail in the middle of next week with the return of positive temperatures at night in the plains and seasonal temperatures in the afternoon.

Many #neige expected in the mountains by Sunday, the most affected massifs would be #Belledonne #Vercors and #Chartreuse A lot of snow also on #Pilat #Jura #Pyrénées #Corse #Queyras ...

Rolled snow storm in Pau! Impressive !! @KeraunosOb@ Meteo_Pyrenees @meteociel


Back
Top Bottom