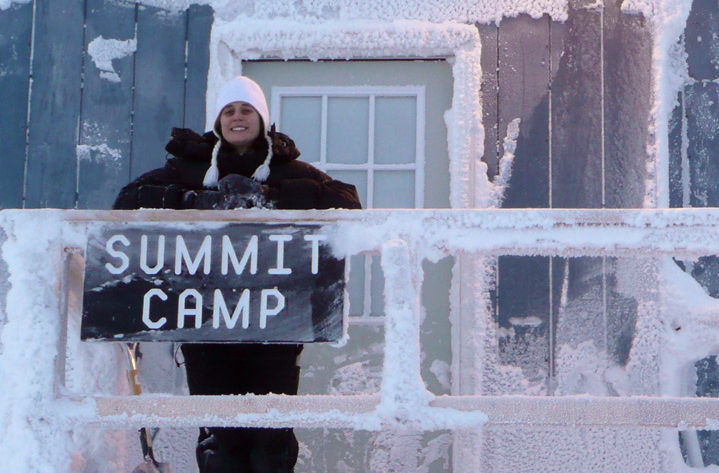
According to SevereWeather.eu the stratospheric polar vortex is the coldest it has been in 40 years, measured at -96°C (-141°F) over Iceland.
They're also relating this to the current outbreaks of Polar Stratospheric clouds which have been called the most vivid locals have ever seen - although to note that these began at least a week or 2 before this report. Maybe even earlier.
It states that the strength of the vortex is often correlated with how cold it is, so it's unusually cold and therefore likely strong. They state that it seems to be "quite beastly"
And the impact it could have on weather:
The full article - which i don't fully understand! - explains it better than i could:
They're also relating this to the current outbreaks of Polar Stratospheric clouds which have been called the most vivid locals have ever seen - although to note that these began at least a week or 2 before this report. Maybe even earlier.
It states that the strength of the vortex is often correlated with how cold it is, so it's unusually cold and therefore likely strong. They state that it seems to be "quite beastly"
And the impact it could have on weather:
Combined with the unusually high pressure in the Pacific, this is a perfect recipe for cold air outbreaks into Canada and western/northern United States. The core polar vortex circulation over the Greenland area promotes cold north flow down into the United States, as seen on the temperature anomaly forecast below. Sadly that means W/SW flow for the SE United States and less chance of a colder winter episode. On the other side, that same polar vortex core over Greenland lowers the pressure in the North Atlantic, and creates a mild zonal flow towards Europe, and promotes pressure building, keeping winter mainly away from the continent. This is a very fine example of a "coupling" between the stronger stratospheric polar vortex and the troposphere.
The full article - which i don't fully understand! - explains it better than i could:
Stratospheric polar vortex reaches coldest temperature in 40 years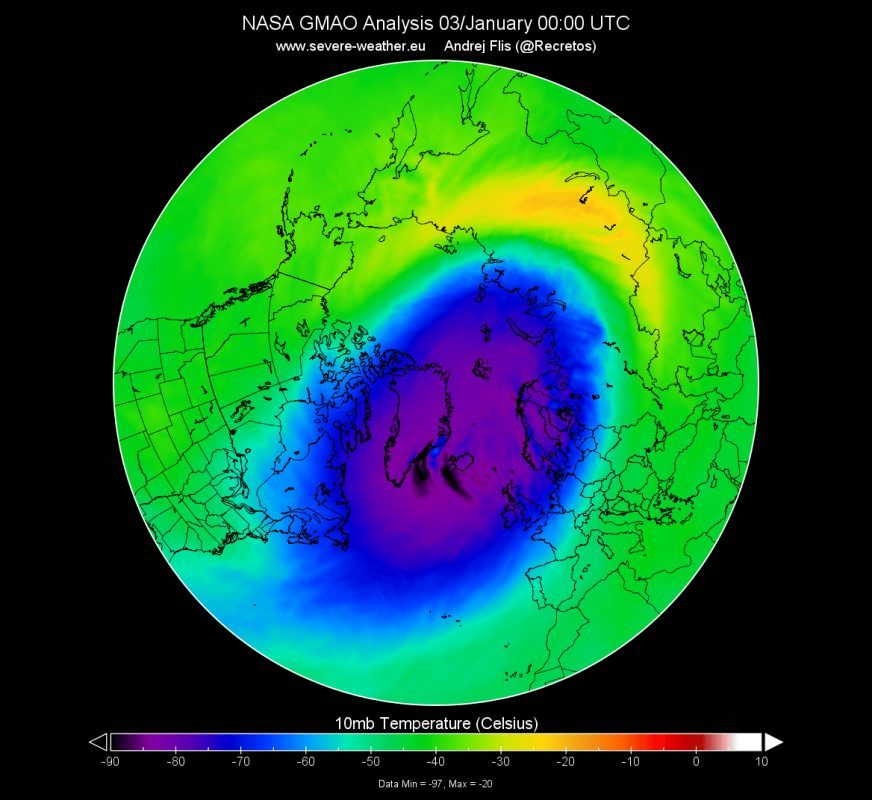
Stratospheric polar vortex reaches coldest temperature in 40 years
The polar vortex has been gaining strength and has reached its peak climatological strength. It is set to be connected with the lower levels, pushing its influence on the weather patterns. On January 3rd, a radiosonde has made measurements of the...www.sott.net
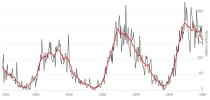
The graph shows the lowest temperature across the Northern Hemisphere, from 50-90°N latitude, where the coldest area of the polar vortex usually is.
The polar vortex has been gaining strength and has reached its peak climatological strength. It is set to be connected with the lower levels, pushing its influence on the weather patterns.
On January 3rd, a radiosonde has made measurements of the mid-stratospheric layers. Measuring over Reykjavik, Iceland, it has recorded the lowest temperature in the stratosphere in the past 40 years, at -96°C (-141°F). The image and data below from the Universtiy of Wyoming, shows the direct measurements made, where we can see the temperature line disappearing below -90°C near the 20mb level. The raw data shows the temperature and altitude, where we can see the -96°C being reached at 17.2mb level, which was around 25.6 km altitude.
Looking at the 10mb level analysis, we can see the lowest temperatures developing as darker/black spots, right around W Iceland and SE Greenland. The analysis from NASA/GMAO actually shows the Greenland dark spot at -97°C, but we do not have direct measurements from that area.
The graph shows the lowest temperature across the Northern Hemisphere, from 50-90°N latitude, where the coldest area of the polar vortex usually is.
NASA/GMAO analysis graph actually showed this minimum to be the coldest temperature in the 40-year record (MERRA-2 data set). The graph shows the lowest temperature across the Northern Hemisphere, from 50-90°N latitude, where the coldest area of the polar vortex usually is. The graph is set for 10mb, while the minimum was directly observed at 17mb. Later fine-analysis will have to confirm the results at 10mb. But in any case, this truly was/is one of the coldest polar vortex peaks in the past 40-60 years. Such cold temperatures enable the development of the Polar Stratospheric Clouds (PSC), which are truly a stunning sight to see!
Comment: Two examples would be the sighting over Siberia on the 23rd of December 2019
© Svetlana Kazina
"The clouds in my photos are so thin that they look more like lace."
And Sweden on the 29th December 2019 - and these occurred prior to the above record low temperatures were observed - there have been a number of other related events since:
© Vimeo/Lights Over Lapland
Temperature is one indicator of the strength of the polar vortex, as it is usually as cold as it is strong. A better estimate of strength is perhaps the actual power, or wind speed of the polar vortex, or the stratospheric polar jet. The stronger the polar jet, the more likely it is for the polar vortex to connect down with our weather and influence the weather patterns. Of course, the actual coupling can be denied by the troposphere, even if we have a strong stratospheric polar vortex, so we need to look at each case individually. We must look at the entire polar vortex to estimate its overall composure and strength, but usually, the 10mb level (~30km altitude) is the sweet spot in the mid stratosphere. The graph from NASA/GMAO shows the strength progression of the stratospheric polar jet stream. We can see the reduction of the jet stream around the time the warming phase was active, which weakened the polar vortex. The warming has ended prematurely, and the polar vortex quickly regained its strength in December and is currently running above-average strength of the polar jet stream.
The graph below from NOAA/CPC shows the progression of the weakening cycle of the polar vortex. First, we had high pressure in the lower levels, in the troposphere (where our weather is), which caused energy waves upwards into the stratosphere, disrupting the polar vortex. The disrupted polar vortex has sent its influence back down, as nicely seen by the progression in December, influencing a more dynamic weather pattern. But while any influence came down from the stratosphere, the stratospheric polar vortex already re-organized and is now starting to "couple" with the troposphere. The coupling means that both the tropospheric and the stratospheric polar vortex are connected and work in a semi-synchronous way.
Another way to look for this coupling, is by looking at the NAM (Northern Annular Mode). Without going into too much detail, it is just one of the ways to estimate the strength of the polar vortex/circulation. Negative values mean a weaker vortex, and positive values mean a stronger vortex. We can nicely see the progression of the negative values and the weaker vortex episode we mentioned above. But what is more important here, is the forecast, which shows positive values across the entire altitude layer, meaning a more likely coupling of the tropospheric and stronger stratospheric polar vortex.
But what exactly are we "coupling" with? Looking at the current analysis, we take a look at the wind speeds at different altitudes. More specifically at the 10mb (30km) and 1mb (45km) level. The strength of the stratospheric polar jet is very impressive. At 10mb, the wind speeds are currently reaching over 400 km/h. But on the top of the stratosphere at 1mb (45km) the wind speeds exceed 600 km/h. So the polar vortex is very healthy and in a good shape. The actual wind speed at this altitude does not really have a direct influence on our weather but combined with the shape of the polar vortex, it does tell us what kind of a beast it is. And currently, the stratospheric polar vortex is quite beastly.
Looking lower down at the troposphere and our weather, we can see the same core location of the polar vortex, over the pole and Greenland/North Atlantic. The North Atlantic region is usually more evident at the surface levels (MSLP).
Combined with the unusually high pressure in the Pacific, this is a perfect recipe for cold air outbreaks into Canada and western/northern United States. The core polar vortex circulation over the Greenland area promotes cold north flow down into the United States, as seen on the temperature anomaly forecast below. Sadly that means W/SW flow for the SE United States and less chance of a colder winter episode. On the other side, that same polar vortex core over Greenland lowers the pressure in the North Atlantic, and creates a mild zonal flow towards Europe, and promotes pressure building, keeping winter mainly away from the continent. This is a very fine example of a "coupling" between the stronger stratospheric polar vortex and the troposphere.
We will keep you updated on any important further development.